Pandas DataFrame#
Learning Objectives
Questions:
What is a pandas
DataFrame?How is a
DataFrameused to manage and manipulate data?
Objectives:
Understand the structure and purpose of a
DataFrame.Create a
DataFramefrom lists.Perform basic
DataFramemanipulations, such as renaming columns and transposing data.Understand the structure and purpose of a pandas
Series.Append
Seriesas columns to an existingDataFrameand create new columns based on existing data.
Import pandas#
# This line imports the pandas library and aliases it as 'pd'.

import pandas as pd
Why pandas as pd?
Aliasing pandas as pd is a widely adopted convention that simplifies the syntax for accessing its functionalities.
After this statement, you can use pd to access all the functionalities provided by the pandas library.
Pandas data table representation#

A DataFrame is a two-dimensional data structure in the pandas library, designed to hold and manage data efficiently. It organizes data into labeled columns and rows, allowing you to store various types of data, such as numbers, text, and categorical values, all within the same structure.
Creating our first DataFrame#
We start by creating three lists of equal length (i.e., containing the same amount of elements).
These lists will be used as columns for a DataFrame, with each list representing a column and each element within the list representing a row in that column.
# Create three lists named 'name', 'age', and 'sex'.

name = ["Braund", "Allen", "Bonnel"]
age = [22, 35, 58]
sex = ["male", "male", "female"]
We use lists name, age, and sex to fill in the columns.
Each list corresponds to a column in the DataFrame.
Name, Age, and Sex are the titles of these columns.
# Create a DataFrame named 'df' based on three lists.

df = pd.DataFrame({'Name': name, 'Age': age, 'Sex': sex})
DataFrames and dictionaries#
Creating a DataFrame in pandas is similar to creating a dictionary. The keys in the dictionary become the column names, while the values, which are lists or arrays, form the columns’ data.
See also
For more information on dictionarys in Python, see GeeksforGeeks.
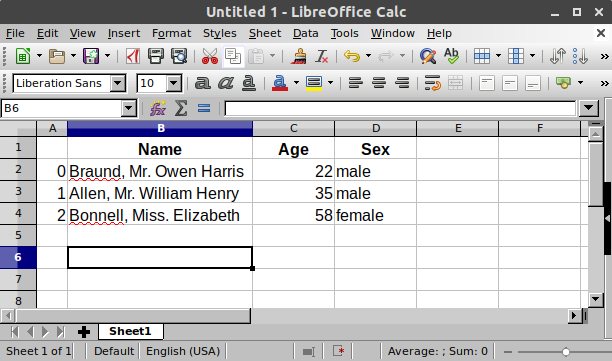
# Display the DataFrame 'df'.

df
In a spreadsheet software, the table representation of our data would look very similar
# Check the type of the 'df' object using the 'type()' function.

type(df)
Attributes#
We can use the shape attribute to determine the dimensions of the DataFrame.
It returns a tuple representing the number of rows and columns (rows, columns). This can be helpful especially if you have not created the DataFrameyourself.
df.shape
And we can use the dtypes attribute to view the data types of each column in the DataFrame.
This command provides information about the data type of each column, such as integer, float, or object (string). This is useful knowledge to have when you start working more in-depth with your data.
df.dtypes
When asking for the shape or dtypes, no parentheses () are used. Both are an attribute of DataFrame and Series. (Series will be explained later.)
Attributes of a DataFrame or Series do not need ().
Attributes represent a characteristic of a DataFrame/Series, whereas methods (which require parentheses ()) do something with the DataFrame/Series.
Transposing a DataFrame#
The transpose() method swaps the DataFrame’s rows and columns, creating ‘df_transposed’.
Transposing is useful for reshaping data, making it easier to compare rows or apply certain operations that are typically column-based.
# Transpose the DataFrame 'df' using the 'transpose()' method.

df_transposed = df.transpose()
# Display the DataFrame 'df_transposed'.

df_transposed
Renaming columns#
We can rename the columns of our DataFrame after creation.
This is done by assigning a new list of column names to df.columns.
The new column names are Names, Age, and Sex, in that order.
# Rename the columns of the DataFrame 'df'.

df.columns = ['Names', 'Age', 'Sex']
The method below is useful for selectively renaming only one or more columns without changing the entire set of column names:
# Rename the 'Age' column to 'Ages' in the DataFrame 'df'.

df = df.rename(columns={'Age': 'Ages'})
# Our DataFrame now looks like this:

df
Series#

Each column in a DataFrame is a Series. When we access a column in a DataFrame, this actually returns a Series object containing all the data in that column.
df['Ages']
# Check the type of the 'Ages' column in 'df' using the 'type()' function.

type(df['Ages'])
Creating our own Series#
We can create and name a Series in the following way.
The name parameter assigns the name ‘Fare’ to the Series.
# Create a pandas Series named 'fare' with specified values.

fare = pd.Series(['7.2500', '71.2833', 'Unknown'], name='Fare')
This outputs the values along with their index positions and the name of the Series:
# Display the 'fare' Series.

fare
# Check the data type of 'fare' using the 'type()' function.

type(fare)
Although our data looks fine at first glance, each cell is actually stored as a string. While we can read the numbers without issue, this will cause problems if we want to use them for calculations.
To solve this, pandas provides a built-in function called to_numeric(), which converts a Series to either an integer or a float, depending on the values.
fare = pd.to_numeric(fare)
However, as seen above, this produces a ValueError due to the “Unknown” value at position 2.
To solve this, we need to use the errors parameter in to_numeric().
Exercise 1: Converting to numeric values#
Convert the cells of the ‘fare’ Series to numeric values.
The “Unknown” value must be convertet to NaN by applying the errors parameter in to_numeric().
Hint: We can get help by using:
help(pd.to_numeric)
Solution
fare = pd.to_numeric(fare, errors='coerce')
This solution changes all cell values to numeric values.
Any values that cannot be converted — such as strings like “Unknown” — will be replaced with NaN instead of raising an error.
Appending Series#
We can add a Series as a new column to a DataFrame, extending it horizontally.
Here, the name of the ‘fare’ Series (‘Fare’) becomes the column name in the updated DataFrame.
# Convert the Series' cells to numeric values

fare = pd.to_numeric(fare, errors='coerce')

# Concatenate the 'fare' Series to the 'df' DataFrame along the columns (axis=1).

df = pd.concat([df, fare], axis=1)

# Display the updated DataFrame 'df'.

df
The axis parameter in pandas.concat() controls whether you combine data row-wise or column-wise:
axis=0(default): Concatenates along rows (adds more rows beneath each other).axis=1: Concatenates along columns (adds new columns side by side).
Attention
While concatenating a Series along axis=1 works smoothly (it becomes a new column), concatenating along axis=0 is less straightforward. A Series is one-dimensional, so pandas does not automatically treat it as a full row in the DataFrame.
To make it work, you first need to reshape the Series into a one-row DataFrame.
This is typically done with .to_frame().T, which is just a compact way of writing .to_frame() followed by .transpose().
An easier and more intuitive solution is often to convert the Series to a list and use df.loc[len(df)] = ... to append it as a new row. This method is described below.
Using .loc to append a row
Instead of reshaping the Series, you can append it directly to the DataFrame with .loc (which you will learn about in a later lesson). The idea is to place the new row at the next available index position, which is simply len(df).
If you already have the values as a list, you can write:
df.loc[len(df)] = extra_row.tolist()
Here pandas inserts the values in the order of the existing columns.
If your Series has index labels that match the column names, you can assign it directly:
df.loc[len(df)] = extra_row
In this case, pandas aligns the labels with the column names, which is safer if the column order changes.
Exercise 2: Create a new column#
Create a new column called ‘Fare_in_DKK’ based on the column ‘Fare’.
We assume the old fare prices to be in GBP and the exchange rate to be £1 = 8.7 DKK
Solution
df['Fare_in_DKK'] = df['Fare'] * 8.7
This solution creates a new column in the DataFrame named ‘Fare_in_DKK’, which contains the fare prices converted from GBP to DKK using the given exchange rate.
Each fare value in GBP is multiplied by the exchange rate to obtain the corresponding fare value in DKK.
Creating a new column based on existing data#
We can also create a new column based on the data in an existing column.
Here, we create a new column ‘Age_in_3_years’ in the DataFrame ‘df’.
This column is calculated by adding 3 to each value in the ‘Ages’ column.
df['Age_in_3_years'] = df['Ages'] + 3
# Display the updated DataFrame 'df'.

df
Key points#
Import the library, aka
import pandas as pd.A table of data is stored as a pandas
DataFrame.The
shapeanddtypesattributes are convenient for a first check.Each column in a
DataFrameis aSeries.We can append
Seriesto an existingDataFrame.